← Home

AI & Ways of Working

AI as a working partner.

AI has genuinely changed what one person can build, analyse, and ship. Things that used to need a team — data pipelines, localised content at scale, functional prototypes, server infrastructure — are now within reach of a single person. This portfolio is a decent example of that.

The catch is that the tool getting more powerful doesn't mean it's getting wiser. I think about it through two analogies. A calculator given a pen — because I'm asking a computational model to do creative work, which means I need to stay close to what it's actually producing. And an autopilot given the cockpit — because no matter how capable the system, the final call has to be human. Both feel true at the same time.

The industry has a term for what happens when people stop paying attention — comprehension debt. It's real, and I've seen it. I haven't written production code in years, but when I build with AI I make sure I understand what's happening well enough to debug it when something goes sideways. And something always goes sideways eventually.

Here's what I've actually built.
Live Work

Things you can click and verify.

Stitch by Google · Claude Code · GitHub Pages

A portfolio site built end-to-end using AI tooling

This portfolio

Needed a portfolio that reflected how I actually work — not just what I've done. Existing templates felt generic. Building from scratch with AI tools also turned the process into a live demonstration of the workflow itself. The full pipeline — visual design, code, deployment — was completed without touching a traditional IDE or hiring a developer.

View live site →

5 pages built

HTML + Tailwind

Stitch → Claude Code

Full pipeline

0 templates used

Built from scratch

ChatGPT · Oracle Cloud · Docker · Ubuntu · FoundryVTT

A self-hosted multiplayer server for tabletop RPG sessions

Headless game server — five cities, zero cost

My players are spread across Bangalore, Chennai, Manali, Thailand, and Canada. Commercial solutions were either expensive or had latency issues. Building my own gave full control and zero recurring cost — hosted on Oracle Cloud's always-free tier.

Beyond the server, the campaign runs with a dedicated Claude project for AI-assisted game management — session logs, NPC rosters, world state tracking, and player character sheets, all maintained and queried through conversation.

View the server →

7 players

Across 5 cities, 2 countries

19 sessions

12 migrated + 7 on Foundry

5–6 hrs

Average session length

9 months

Running since July 2025

ChatGPT · Python · Jupyter · Polars · Matplotlib

1.7M rows of field telemetry → data-backed marketing claims

Fleet battery data analysis

Traditional battery marketing is built around peak capacity and ideal conditions. But homes spend most of their time — up to 6,500 hours a year — running small loads like fridges, routers, and lights. This is precisely where conventional hybrid inverters are least efficient, dropping below 70% round-trip efficiency. Without field data, this was directionally understood but not proven at scale.

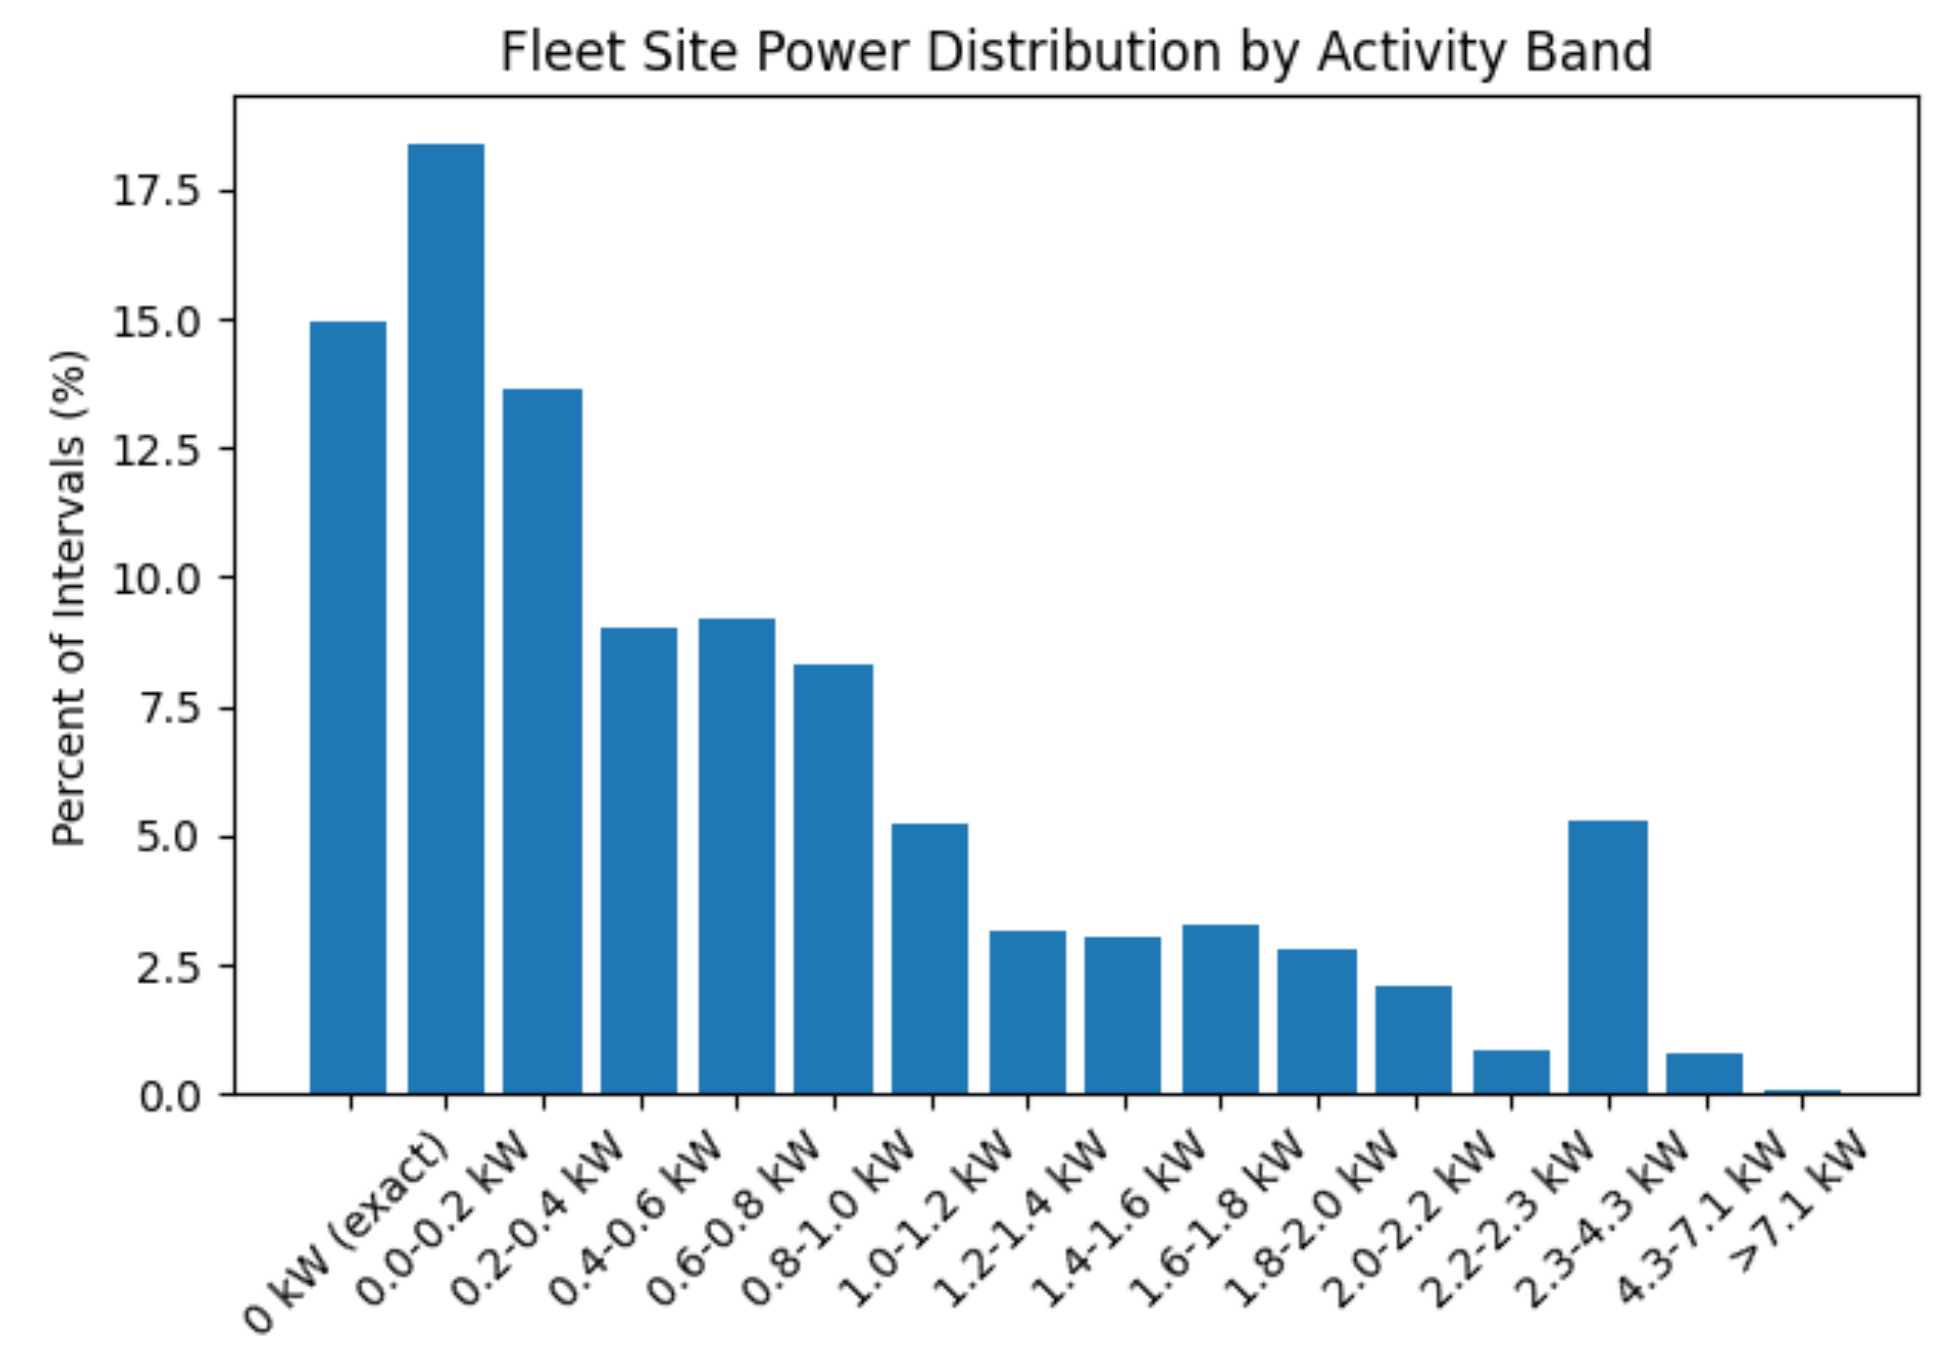
The analysis processed 1.7 million rows of real Enphase Enlighten telemetry to quantify how much time homes actually spend in low-load conditions, and at which power bands. That data became the evidentiary foundation for the PowerMatch positioning — a fleet-backed answer to the question: how bad is the low-load efficiency problem in practice? The sales sheet below is the commercial output of that analysis.

Published sales sheet informed by this analysis

Introducing PowerMatch — IQ Battery 5P →
# Group by site and timestamp
site_power = (
    df_clean
    .group_by(["Site Id", "Local Timestamp"])
    .agg([
        pl.sum("Discharged Power(KW)")
          .alias("site_discharge_kw"),
        pl.sum("Charged Power(KW)")
          .alias("site_charge_kw")
    ])
)
Fleet Site Power Distribution by Activity Band

Fleet Site Power Distribution by Activity Band — generated from 1.7M rows of field telemetry

Windsurf · Cascade · Python · Jira API

Automated cross-project status reporting with AI analysis

Jira sprint report summariser

Tracking launch readiness across documentation, compliance, web, and app teams meant manually checking dozens of tickets across different Jira projects. Information was scattered, patterns were invisible, and things slipped.

The tool pulls live Jira data and produces a structured status report with AI-generated analysis. It gives me three things: a single view across all projects and ticket states; early warning on which team is becoming a bottleneck before it becomes a blocker; and automatic surfacing of stale tickets — critical for compliance listings and grid whitelisting that can take 3–6 months and need consistent follow-up.

View demo report →

Demo report uses fictional data generated for confidentiality. The tool runs against live Jira projects in production.

← Back to portfolio